Triangle Plots
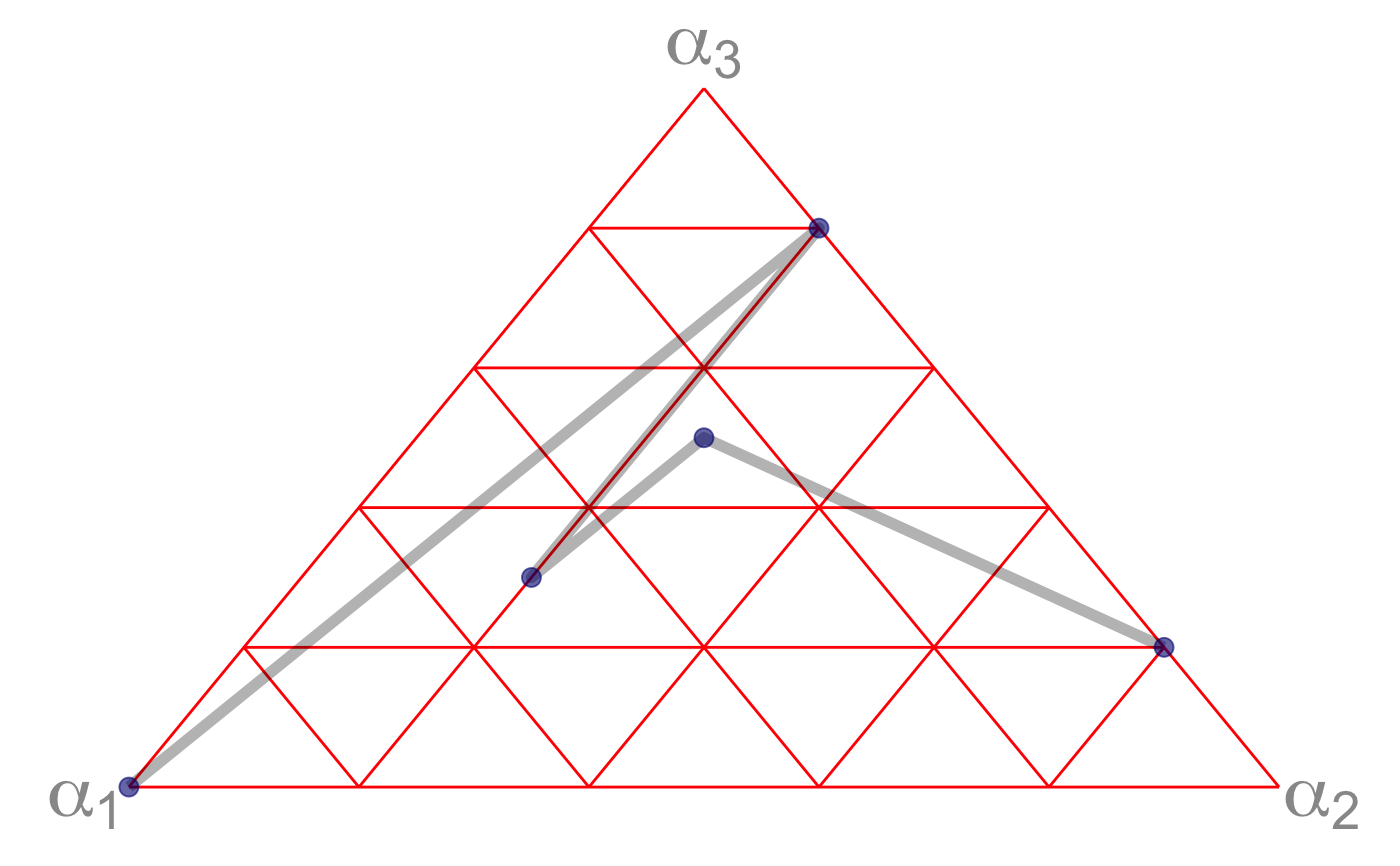
StatTriangle

stat_triangle(mapping = NULL, data = NULL, geom = "point",
  position = "identity", show.legend = NA, inherit.aes = TRUE, ...)

tri_grid(colour = color, color = "gray70", grid_lines = 5,
  labels = c("alpha[1]", "alpha[2]", "alpha[3]"), ...)

tri_labels(labels = c("alpha[1]", "alpha[2]", "alpha[3]"),
  parse = TRUE, colour = color, color = "gray60", size = 4,
  padding = 0.1, ...)

geom_tripoint(..., stat = "triangle")

geom_triline(..., stat = "triangle")

geom_tripath(..., stat = "triangle")
Format
An object of class StatTriangle (inherits from Stat, ggproto, gg) of length 3.
Examples
#> Warning: `data_frame()` is deprecated, use `tibble()`. #> This warning is displayed once per session.ggplot() + tri_theme() + tri_grid(colour="red") + tri_labels(size=10, padding=.05) + geom_path(data=ddd, aes(x=x, y=y, z=z), stat="triangle", size=2, alpha=.3) + geom_point(data=ddd, aes(x=x, y=y, z=z), stat="triangle", size=3, alpha=.6, colour="navy")